In this article I will explain how to debug JavaScript in Visual Studio 2010, 2012 and 2013 using Internet Explorer browser.
In ASP.Net projects, we can easily debug JavaScript by running the website in Debug mode in Internet Explorer using Visual Studio.
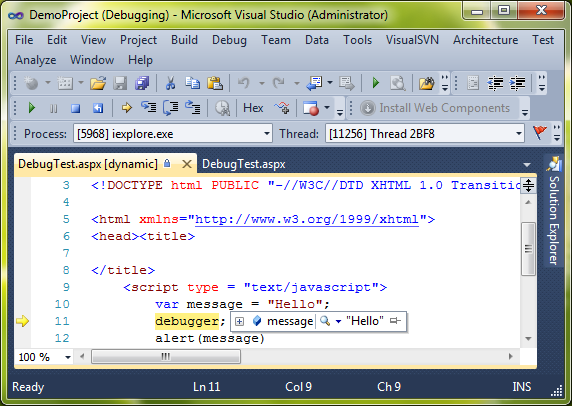
1. Add the keyword debugger to the line where you want the debugger to halt the code execution as show below and then run the Visual Studio in Debug mode by pressing F5 or using the Debug button.
2. Now you will notice that the code execution has stopped on the line where you have put the debugger keyword. You can put the debugger keyword wherever you want to even in JS script files. But note that this keyword works only with Internet Explorer (IE) and not with other browsers.